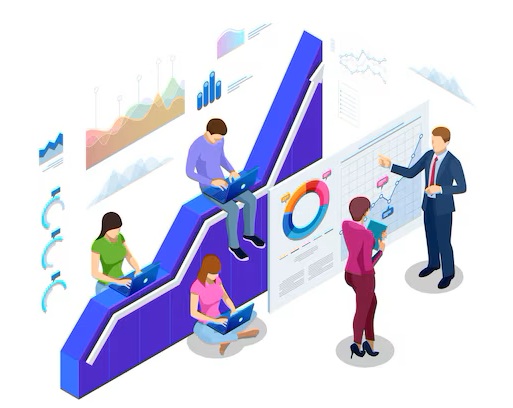
In a world where data plays a decisive role, our data visualization service gives you the ability to transform complex information into clear and intuitive graphs and charts. We offer modern tools that will help you analyze data, identify trends, and make informed decisions.
Data visualization service
Transform data into powerful insights
Why choose us

Intuitive interface
Our service is designed so that even users with minimal technical skills can easily create and interpret data visualizations.
Wide range of visualizations
We offer a variety of chart and graph types, including line graphs, bar charts, pie charts, heatmaps, and much more.
Flexibility and adaptability
Our service allows you to easily tailor visualizations to the specific needs of your business.
Real time updates
Update your data and visualizations in real time to always stay informed about the latest changes and trends.
Integration
Our service seamlessly integrates with popular data analysis platforms and tools, such as Excel, Google Sheets, SQL, and others.
Data is a powerful tool for decision-making, but only if it is presented in a clear and visually appealing way. We create interactive and visually engaging data visualization solutions that will help you effectively communicate information to your audience and enhance the user experience.
